Microsoft PL-300 Real Exam Questions
The questions for PL-300 were last updated at Jan 25,2026.
- Exam Code: PL-300
- Exam Name: Microsoft Power BI Data Analyst
- Certification Provider: Microsoft
- Latest update: Jan 25,2026
You are developing a report page. Some users will navigate the report by using a keyboard, and some users will consume the report by using a screen reader. You need to ensure that the users can consume the content on a report page in a logical order.
What should you configure in Microsoft Power Bl Desktop?
- A . the bookmark order
- B . the layer order
- C . the tab order
- D . the X position
What is the minimum number of datasets and storage modes required to support the reports?
- A . two imported datasets
- B . a single DirectQuery dataset
- C . two DirectQuery datasets
- D . a single imported dataset
HOTSPOT
You are creating a Microsoft Power Bl model that has two tables named CityData and Sales.
CityData contains only the data shown in the following table.

Sales contains only the data shown in the following table.

For each of the following statements, select Yes if the statement is true. Otherwise, select No. NOTE: Each correct selection is worth one point.

You have multiple dashboards.
You need to ensure that when users browse the available dashboards from powerbi.com. they can see which dashboards contain Personally Identifiable Information (Pll). The solution must minimize configuration effort and impact on the dashboard design.
What should you use?
- A . Active Directory groups
- B . tiles
- C . data classifications
- D . comments
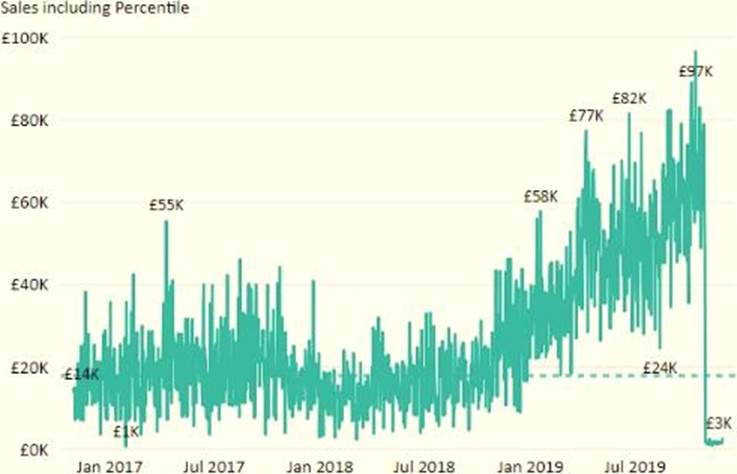
You plan to create the chart shown in the following exhibit.

How should you create the dashed horizontal line denoting the 40th percentile of daily sales for the period shown?
- A . Create a horizontal line that has a fixed value of 24,000.
- B . Add a measure to the visual that uses the following DAX expression.
Measure – PERCENTUEX.EXC (Sales,Sales[Total Sales],©.40) - C . Add a new percentile line that uses Total Sales as the measure and 40% as the percentile.
- D . Add a measure to the visual that uses the following DAX expression.
Measure = PERCENTILEX.INC (Sales,Sales[Total Sales],6.40)
Your company has employees in 10 states.
The company recently decided to associate each state to one of the following three regions: East, West, and North.
You have a data model that contains employee information by state. The model does NOT include region
information.
You have a report that shows the employees by state.
You need to view the employees by region as quickly as possible.
What should you do?
- A . Create a new aggregation that summarizes by employee.
- B . Create a new group on the state column and set the Group type to List.
- C . Create a new group on the state column and set the Group type to Bin.
- D . Create a new aggregation that summarizes by state.
DRAG DROP
You receive revenue data that must be included in Microsoft Power Bl reports.
You perform an initial load of the data from a Microsoft Excel source as shown in the following exhibit.

You plan to create several visuals from the data, including a visual that shows revenue split by year and product.
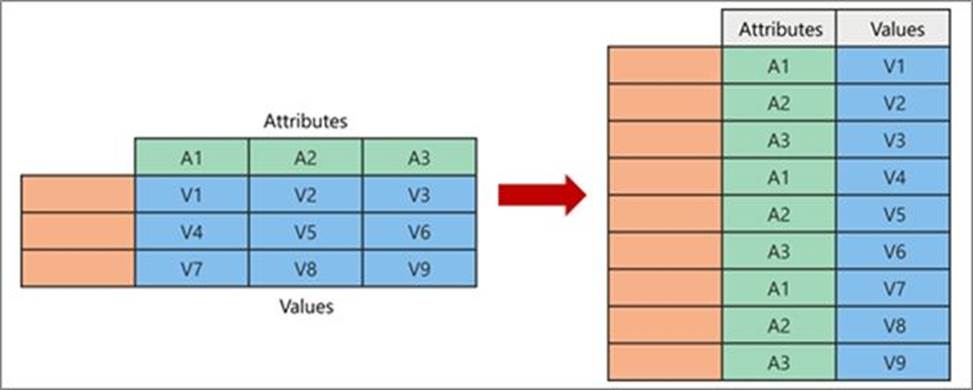
You need to transform the data to ensure that you can build the visuals. The solution must ensure that the columns are named appropriately for the data that they contain.
Which three actions should you perform in sequence? To answer, move the appropriate actions from the list of actions to the answer area and arrange them in the correct order.

DRAG DROP
You receive revenue data that must be included in Microsoft Power Bl reports.
You perform an initial load of the data from a Microsoft Excel source as shown in the following exhibit.

You plan to create several visuals from the data, including a visual that shows revenue split by year and product.
You need to transform the data to ensure that you can build the visuals. The solution must ensure that the columns are named appropriately for the data that they contain.
Which three actions should you perform in sequence? To answer, move the appropriate actions from the list of actions to the answer area and arrange them in the correct order.

You need to create a calculated column to display the month based on the reporting requirements.
Which DAX expression should you use?
- A . FORMAT(‘Date'[date], "MMM YYYY")
- B . FORMAT(‘Date’ [date], "M YY")
- C . FORMAT(‘Date'[date_id], "MMM") & "" & FORMAT(‘Date'[year], "#")
- D . FORMAT(‘Date’ [date_id], "MMM YYYY")
Which DAX expression should you use to get the ending balances in the balance sheet reports?
- A . CALCULATE (
SUM( BalanceSheet [BalanceAmount] ),
DATESQTD( ‘Date'[Date] )
) - B . CALCULATE (
SUM( BalanceSheet [BalanceAmount] ),
LASTDATE( ‘Date'[Date] )
) - C . FIRSTNONBLANK ( ‘Date’ [Date]
SUM( BalanceSheet[BalanceAmount] )
) - D . CALCULATE (
MAX( BalanceSheet[BalanceAmount] ),
LASTDATE( ‘Date’ [Date] )
)


