Microsoft PL-300 Real Exam Questions
The questions for PL-300 were last updated at Jul 08,2025.
- Exam Code: PL-300
- Exam Name: Microsoft Power BI Data Analyst
- Certification Provider: Microsoft
- Latest update: Jul 08,2025
Note: This question is part of a series of questions that present the same scenario. Each question in the series contains a unique solution that might meet the stated goals. Some question sets might have more than one correct solution, while others might not have a correct solution.
After you answer a question in this section, you will NOT be able to return to it. As a result, these questions will not appear in the review screen.
You create a parameter named DataSourceExcel that holds the file name and location of a Microsoft Excel data source.
You need to update the query to reference the parameter instead of multiple hard-coded copies of the location within each query definition.
Solution: You create a new query that references DataSourceExcel.
Does this meet the goal?
- A . Yes
- B . No
HOTSPOT
You need to create a solution to meet the notification requirements of the warehouse shipping department.
What should you do? To answer, select the appropriate options in the answer area. NOTE: Each correct select is worth one point:

HOTSPOT
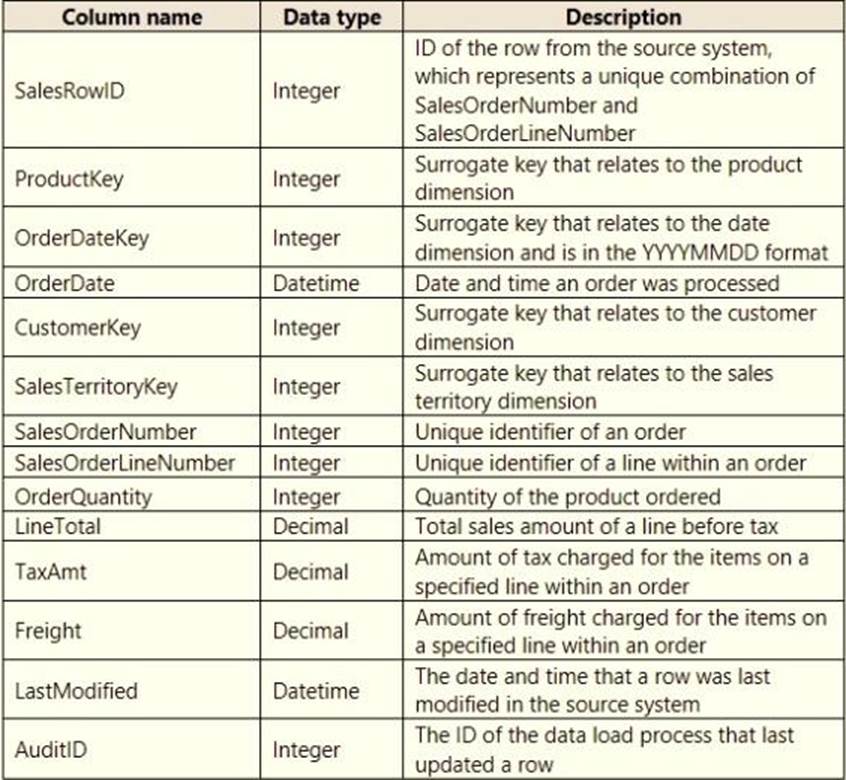
You are creating a Microsoft Power Bl imported data model to perform basket analysis. The goal of the analysis is to identify which products are usually bought together in the same transaction across and within sales territories.
You import a fact table named Sales as shown in the exhibit. (Click the Exhibit tab.)

The related dimension tables are imported into the model.
For each of the following statements, select Yes if the statement is true. Otherwise, select No. NOTE: Each correct selection is worth one point.

Your company plans to completely separate development and production assets such as datasets, reports, and dashboards in Microsoft Power Bl.
You need to recommend an application lifecycle strategy. The solution must minimize maintenance to update access and prevent end users from viewing the development assets.
What should you recommend?
- A . Create production reports in a separate workspace that uses a shared dataset from the development workspace. Grant the end users access to the production workspace.
- B . In the same workspace, create separate copies of the assets and append DEV to the names of the copied assets. Grant the end users access to the workspace.
- C . Create separate workspaces for development and production. Grant the end users access to the production workspace.
- D . Create one workspace for development. From the workspace, publish an app for production.
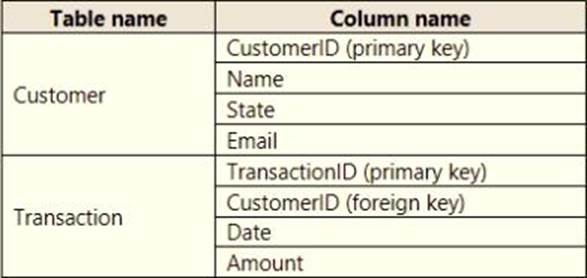
You build a report to analyze customer transactions from a database that contains the tables shown in the following table.

You import the tables.
Which relationship should you use to link the tables?
- A . one-to-many from Customer to Transaction
- B . one-to-one between Customer and Transaction
- C . one-to-many from Transaction to Customer
- D . many-to-many between Customer and Transaction
You have a collection of reports for the HR department of your company.
You need to create a visualization for the HR department that shows a historic employee counts and predicts trends during the next six months.
Which type of visualization should you use?
- A . scatter chart
- B . ribbon chart
- C . line chart
- D . key influences
HOTSPOT
Your company has affiliates who help the company acquire customers.
You build a report for the affiliate managers at the company to assist them in understanding affiliate performance.
The managers request a visual showing the total sales value of the latest 50 transactions for each affiliate. You have a data model that contains the following tables.

You need to develop a measure to support the visual.
How should you complete the DAX expression? To answer, select the appropriate options in the answer area. NOTE: Each correct selection is worth one point.

You need to configure access for the sales department users. The solution must me meet the security requirements.
What should you do?
- A . Add the sales department as a member of the reports workspace
- B . Add the Azure Active Directory group of the sales department as an Admin of the reports workspace.
- C . Distribute an app to the users in the Azure Active Directory group of the sales department.
- D . Share each report to the Azure Active Directory group of the sales department.
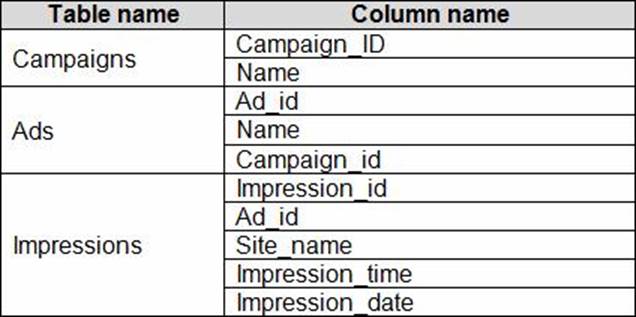
You have the tables shown in the following table.

The Impressions table contains approximately 30 million records per month.
You need to create an ad analytics system to meet the following requirements:
✑ Present ad impression counts for the day, campaign, and Site_name. The analytics for the last year are required.
✑ Minimize the data model size.
Which two actions should you perform? Each correct answer presents part of the solution. NOTE: Each correct selection is worth one point.
- A . Group the impressions by Ad_id, Site_name, and Impression_date. Aggregate by using the CountRows function.
- B . Create one-to-many relationships between the tables.
- C . Create a calculated measure that aggregates by using the COUNTROWS function.
- D . Create a calculated table that contains Ad_id, Site_name, and Impression_date.
You import two Microsoft Excel tables named Customer and Address into Power Query.
Customer contains the following columns:
✑ Customer ID
✑ Customer Name
✑ Phone
✑ Email Address
✑ Address ID
Address contains the following columns:
✑ Address ID
✑ Address Line 1
✑ Address Line 2
✑ City
✑ State/Region
✑ Country
✑ Postal Code
The Customer ID and Address ID columns represent unique rows.
You need to create a query that has one row per customer. Each row must contain City, State/Region, and Country for each customer.
What should you do?
- A . Merge the Customer and Address tables.
- B . Transpose the Customer and Address tables.
- C . Group the Customer and Address tables by the Address ID column.
- D . Append the Customer and Address tables.


